Dollar Shave Club (DCS) – Viral video launches an overnight business success

Student : Tony Singh
Student Number : 212401746

Viral video hits the mark – Dollar Shave Club


Dollar Shave viral video proves a good approach to marketing metrics can drive business results.

The Market

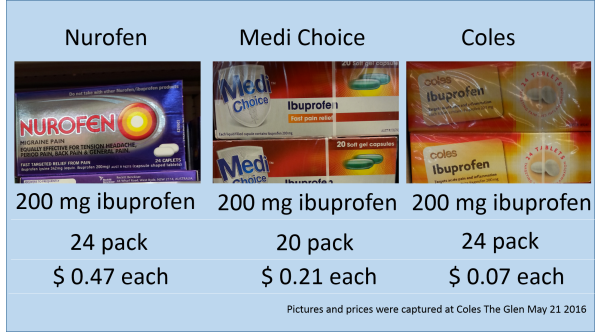
Its surprising to find that the market for razors alone is a “whopping $14 billion worldwide”. Ninety percent of all sales are coming from two manufacturers: Gillette and Schick. As the saying goes success invites competition so it’s not surprising that the good folks at Dollar Shave Club (DSC) would emerge.

Our razors are F$%^ing great!!

By starting with a simple video that went viral the the dollar shave club have had phenomenal growth in 2012. In just 2 days they received 12000 subscribers in 2 days. By the end of 2012 the company had made $4 million, in 2013 they reached $13 million. In 2014 this went to $64 million.Ref.

The Dollar Shave club created a unique value proposition that has definately resonated with men everywhere. They

  • Helped people save time they would have spent buying razors.
  • They save money as the razors are cheaper than what you buy in the store.
  • The customer has a regular supply of sharp blades.
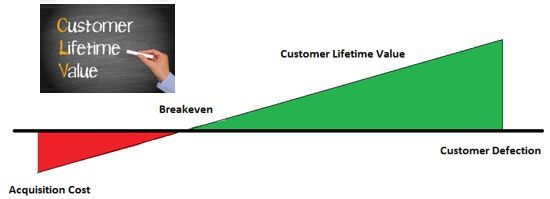
What is CLV?

CLV (Customer Lifetime Value) is an important metric that is often misunderstood many companies. B2C businesses should be aware but very few are.

Challenges arise as to the measure of it due to the many different ways the information can be gathered to influence the figure. Put simply the CLV is the amount of revenue a customer will generate for a business over its product lifetime.

The question should always be asked : how much should a company spend on marketing campaigns? Who are my customer segments? What products should I offer etc? Lead generation is a key marketing focus but a company must ask itself how much is this lead worth and what is the cost of new leads.

customer-lifetime-value

Subscription services

The whole DSC model is to pay for the razors via subscription.Subscription services are a good way to maintain, retain and collect revenue from customers. A product needs to be compelling and valuable to a large consumer base to be effective. Calculating your Customer Lifetime Value (CLV) needs to be paramount in managing your business.

A simple CLV for dollar shave could be calculated as follows:

A standard subscription is $7/mo. So the question is how much should Marketing spend to acquire a new customer? Let’s find out.

CLV = (Average Order Value) x (Number of Repeat Sales) x (Average Retention Time).

CLV = $7 * 12 months * 5 years  = $420

This means that user acquired today would be expected to generate revenue of $420 over the next 5 yrs, OR  $84 per year.  If the Dollar Shave Club is to break-even within a year it can afford to spend up to $84 on marketing/sales to acquire a user. Therefore the Customer Acquisition Cost (CAC) = $180

Knowing the CAC changes the formula to CLV = average revenue from a customer per year * average retention rate – CAC.

The key to understanding the CLV is that the CLV > CAC and that companies should look to recover the CAC in the year.

CLV is a key part of a companies strategy so is not widely published but some other companies assumed CLV based on analyst reports is

  • Apple: iPhone = $700 to $900; Mac = $600 to $650; iPad = $275 to $300 (Bernstein)
  • eCommerce companies: Best in class = $3600; Other companies = $1300 (RJMetrics)
  • Starbucks, supposedly, has CLV of ~25K. Read on for Starbucks CLV analysis.
  • Netflix = $291.25

The Dollar Shave Club uses a number of other metrics to understand the desires of their user base. The Monthly Average Revenue Per User formula which is calculated as follows

Monthly Subscription ARPU = Subscription Revenue / Average Subscribers

This allowed DSC to understand the average subscription revenue generated per user each month. The easiest way to calculate this metric is to take the revenue generated from subscriptions and divide it by the average number of subscribers over that period.

DSC also uses a a churn percentage to understand customer patronage. This is calculated as

Monthly Subscriber Churn Percent = Subscribers lost in month / Base of subscribers at beginning of month

Any subscription-based model should understand monthly subscriber churn. For instance after 36 months, a company with 1 percent monthly churn will retain roughly 70 percent of its customer base. On the flip side, a company with a 6 percent monthly churn will only retain 11percent of its customer base.

Understanding these metrics has helped Dollar Save club growth and adapt their brand and offering to an already engaged market.

The take away

Understanding the CLV and other marketing metrics of your product specific to individual/segmented customers can help marketers target specific product/content. Customer’s happiness equals success for your brand and this in turn translates to more revenue and brand recognition for your company.

Dollar Shave Club have created quite an impression on a traditionally boring market. Simple marketing metrics gives you deep insights into customer engagement.

Reference

  • Rao, P (2016),  CLV: One key metric that every company must measure,  https://pramodrrao.wordpress.com/tag/dollar-shave-club-clv/ [Accessed 30 September 2016]
  • Ray, T, Apple: Bernstein Sees $204B in ‘Customer Lifetime Value’, http://blogs.barrons.com/techtraderdaily/2012/02/06/apple-bernstein-sees-204b-in-customer-lifetime-value/ [Accessed 30 September 2016].
  • Saljoughian, P (2015) Easily Measure The Profitability Of Your Consumer Subscription Business, https://techcrunch.com/2015/10/05/easily-measure-the-profitability-of-your-consumer-subscription-business/ [Accessed 30 September 2016]
  • Weintraub, T , Lifetime Customer Value Case Study: Starbucks [Infographic] [Accessed 30 September 2016]
  • Ziehl, M (2016), 5 Things You Can Learn About Subscriptions from Dollar Shave Club, Available at http://blog.rechargeapps.com/5-things-you-can-learn-about-subscriptions-from-dollar-shave-club/ [Accessed 30 September 2016]


Pricing for Group Effect

By Tony Singh ID 212401746

The prevalence of online discount coupons sites are becoming very popular in a deal hungry online population. Consumers are scouring the web for better deals on restaurants, hotels and vacations, hair and nail care, and a plethora of other goods and services.

Groupon Main Page

Source : Groupon Australia

Groupon is a market leader in this space offering a compelling interaction between businesses and consumers by presenting goods and services at a discount. Sometimes at very substantial discounts from the normal retail price. It is this platform that allows Groupon to be so successful. Launched in 2008 the site is extremely successful website recently passing in a $6Billion buyout from Google.

The concept of coupons is based on the loss leader principle. The idea is essentially this – consumers take advantage of a significantly discounted one off purchase for a good or service with the tail end benefit being that this same consumer will later pay full price for the good or service at the next visit. Further the site regularly offers enticement for higher valued items in the same discounted offering. The coupons are time boxed and are only available for a short period of time.

Loss leaders are a known pricing strategy and is key for allowing your business to gain new customers and increase return visitors. This is precisely what Groupon seeks to promote to its business subscribers


How discount sites work?

Groupon and other online coupon sites offer discounts on goods and services based in your local area. This allows the platform to maintain a degree of personalisation to the experience. The offers are local and relevant. The coupons are not actually distributed until a specific critical mass of people have committed to the purchase. No coupons are a issued if there are not enough people expressing interest or laying down commitments to purchase the coupon.

The concept works on a win-win basis. Groupon have developed a platform that allows businesses to present a deal or coupon to new customers, they get a 50% cut of bringing in that new customer and the business win by bringing their product or service to a new customer. Other sites have tried and are operating in this space but Groupon has grabbed significant market share. As the NY Times describes “It has 175 North America cities and 500 overseas, it is the fastest growing web company in history having attained a value of $1.5 Billion in only 18 months”


Why would consumers use them?

NowLater

Discounts work on the principle of urgency. Groupon have made online discounts an artform by limiting the discounts availability to a specific period of time. Time boxing this creates an immediacy that is compelling to a number of potential purchasers. The psychology of the purchase is that If they don’t buy the product now at the discounted price, they’re likely to miss out on saving some money. The anticipation of the consumer missing out is the precise reason the power of Groupon works. According to the Pleasure Principle and the Regulatory Focus Theory people seek pleasure and avoid pain. The author of Yoast asserts that it is this anticipation of missing out on a discount is definitely a pain people will want to avoid.

Of course discounts represents prudency when it comes to purchases. Why wouldn’t you want to save money on consumer goods and services? Consumers are always looking for the best deal when parting with their dollars. However there are some negatives when it comes to this form of service offering


Are coupons a good thing?

Psychology today asserts that the american consumer is crazy about coupons. The publication details that 40% to 80% of Americans use coupons regularly. On first review its seems that this is what any prudent or efficient shopper should do but on deeper analysis the following is a key issue for consumers and users of coupons like Groupon.

  • Pricing is ignored when using the coupon. Evidence shows that consumers are often excited by the prospect of getting a deal and focusing on the percentage saving without analysing whether it actually is a saving. Cautions should be made with using coupons and Groupon are experts at creating the gloss and glamour of a good deal.

MainGrouponPage

Source: Groupon Australia

  • Coupon purchases are often done often with things that people do not essentially need. An american consumer report identified that 63% of consumers bought things they don’t need because of a coupon.

From a business perspective this may be ideal as a one off purchase for your goods. But to build a sustainable brand and customer loyalty you need to promote goods and services hat resonate value to the consumer.

Coupon Value Concerns

Groupon says that the system works and works well. It claims that 97 percent of companies that offer deals on the site ask to be featured again. But some questions have been raised as to Groupon’s efficacy for businesses. Some businesses complain that Groupon customers are bargain chasers who quickly move on to the next cheap offer. This has mentioned previously does not build a sustainable offering. In fact, a recent study at Rice University found that 80 percent of customers who buy discount deals from sites like Groupon and LivingSocial are first-time customers, and that only 20 percent of them ever return. Even worse for the bottom line, only 36 percent buy goods or services beyond the value of the Groupon

Interestingly, it was found that one in five people who buy a Groupon or similar discount never redeem the voucher. Instead of losing 50 percent on the deal, the business gets paid for not providing any product or service.


Chasing a bargain has never been easier but how sustainable the model is for your business remains to be seen.

References


By Tony Singh. ID – 212401746

Tesla.. Transforming the world one electron at a time.

What is the Tesla Power Wall?

The Tesla power wall is an innovative new product from the world’s most recognised brand in consumer electric automotive and energy storage. Their latest offering of consumer power storage for households is an exciting move for the company that wants to disrupt the power consumption market with a very simple alternative – Store the power from your solar cells so it can be used when you want.

If Elon Musk (CEO) is successful he would have discovered the Holy Grail of consumer power.

The Powerwall  is a home battery that charges using electricity generated from solar panels, or when utility rates are low. This allows you to use this power in the evening or when necessary. Powerwall enables domestic consumers to fully utilise stored power. This was difficult to achieve some ten years ago as battery technology was in its infancy.


Power just got sexy

The look and feel of the Tesla Power Wall is almost that out of science fiction or an Apple iPhone lab. It is slick and smooth showing all the hallmarks of good design.


The base model is a 7kWh lithium-ion battery storage system that comes with a 10 year warranty. Keeping a slim design focuses the brand as a modern device suitable for the home rather than a bulky looking industrial box.

It is with this design that Tesla believes will appeal to the consumer power market. The science behind the problem is deceptively simple given the advancement in battery technology.

Segmentation

Tesla is pitching the Powerwall solution to the established solar panel market. Tesla have their sites on the Australian market as there has been large scale adoption of solar panels. According to the Energy Supply Association of Australia, we have the highest rate of household solar panel installations in the world.

Current pricing has the units set at $14,000 to $15,000 or $12,000 if you already have solar panels. Depending on energy needs of the average house additional batteries may need to be purchased but the system does scale.

Not all domestic power consumers will find the solution useful this is why Tesla have kept the segmentation very simple. Basically you have two options – Power Pack for business consumers (small scale offices) and Powerwall (domestic households)

Different Types of Powerwall

Source : Tesla Australia

Domestic consumers are the key target market. Tesla plans for Mums and Dads that have already invested in solar panels to allow them to leverage their solar power investment further.


Targeting the wealthy?

Do only rich westerners get a look in here? Tesla have identified the big problem of the new century. Affordable power storage for everyday consumption. The solution suits a very specific demographic.

Tesla are targeting middle class Australian homes that can afford the start-up costs in installing the solution. The demographic is cost conscience mums and dads looking to get a return on investing in do it yourself power provision.

Return on Investment (ROI) Calculators are the first to offer detailed advice on how the investment in it can provide a return. With certain groups claiming that a the Powerwall solution can deliver a 6 year payback in Australia.

“In Australia, the price you are paid for the excess solar power your home generates is lower than the price you pay for electricity from the grid,” a statement from Tesla says.

“Given this rate structure, it is more cost effective to consume your solar power than to sell it back to the utility. By storing your home’s surplus power and using it when you would otherwise need to pull from the grid, Powerwall minimises your net spending.”

This is the key benefit of the solution and Tesla are banking the farm on the success of this strategy.


Positioning the power wall

Forbes recognises the huge potential of the stored energy market. American Vanadium predicts massive growth in this sector

Given the brand recognition of Tesla products being of high quality coupled with the worlds increasing need to find better alternative power alternatives, the Powerwall is geared for growth.

As far as where the Powerwall sits on the positioning matrix

Matrix

Source : Iacobucci p61

It is clear the product sits on the high end side of the ledger. Distribution is exclusively managed through key third parties or via Tesla’s online presence. There are few options in terms of products on offer but the problem is defined very simply. Musk is masterfully promoting the problem as a solution that will change the world. As he states 

“Tesla is not just an automotive company, it’s an energy innovation company. Tesla Energy is a critical step in this mission to enable zero emission power generation.” He professes a simple dilemma that will resonate with any consumer of power; which is all of us

“We have this handy fusion reactor in the sky, called the Sun,” he said, stressing that solar power is the best way to end the world’s addiction to fossil fuels and head off a disastrous future in which we are overwhelmed by CO2 in the atmosphere.

The opportunity to change the world might be just here…


References


  • Iacobucci, D 2013, MM4 Marketing Management, 6th Edition, Cengage Learning, Mason USA.


Tesla’s Power Solutions – Power packs pack a punch

Marketing Metrics: Will we ever have the perfect dashboard?

Student Id: 90426817

In 2004, a Bloomberg article titled, Making Marketing Measure Up, provided the context, if not rational for establishing marketing metrics:

“For years, corporate marketers have walked into budget meetings like neighborhood junkies. They couldn’t always justify how well they spent past handouts or what difference it all made. They just wanted more money — for flashy TV ads, for big-ticket events, for, you know, getting out the message and building up the brand”. (Bradey & Kiley 2004)

Brady & Kiley went on to explain that the new marketing mantra was “measurement and accountability”, especially in relation to ROI figures to satisfy “fed up CEOs and CFOs”. It discussed the cutting edge use of dashboards by the likes of consumer-product giants (Proctor and Gamble) to collect multiple performance measures.  It was clear that financial metrics were the focus.

Since 2004 a vast array of marketing research, literature and textbooks (Farris, 2009, Farris 2015, Ambler & Roberts 2008, Mintz & Currim, 2013, Kotler & Keller 2012) argue the benefits of using a wider range of metrics, including non-financial metrics such as customer loyalty and brand awareness to measure marketing performance. Choosing metrics that are relevant to the business and its strategy and ensuring the metrics are relevant to what the organisation is trying to measure (indeed first figuring out what should be measured) is cited as critical for obtaining any meaningful evaluation. Nevertheless,  it is apparent from recent marketing trade articles such as “How Nivea delivered a better ROI on marketing spend”, that in the wider business world, the use of a single metric or a number of  financial measures ‘combined’ to create a silver metric (Ambler & Roberts 2008) is still de rigueur.

ROI

What is apparent when researching literature on the topic of marketing evaluation, is that the focus is often on promotional and media activities or specific advertising campaigns, without much consideration of the other 3Ps in the marketing mix. The use of ROI, or even the adapted ROMI (Return on Marketing Investment) and consideration of both short term and long term ‘returns’, essentially ‘positions’ marketing as an investment that is being made by the organisation; one where there is a choice and risk associated with that investment. Certainly this can apply to advertising and other specific promotional activities, but not as neatly to broader marketing activities: Ambler & Roberts (2008) define marketing as “what the whole company does to satisfy customers and thereby create shareholder value” (p734).

From this standpoint, Ambler & Roberts (2008) reasonably argue that one of the (many) problems with using ROI to evaluate marketing is that by regarding marketing as an investment instead of a ‘maintenance’ essentially “creates another problem for marketers, namely the expectation that marketing will always create incremental sales and profits”(p736).

As identified by one marketing authority, Professor Ujwal Kayande,  the now prevalent use of  “analytics to calculate the ROI and impact of every marketing activity being undertaken” is also a cause for concern; “The problem is that it then forces the CMO and their team to start doing things on which you can measure the ROI, and which you can attribute clearly to your activities to (…) As a result, innovation starts becoming stifled” (Kayande, U, 2015).

Also apparent in the literature is the vast number of metrics available to calculate marketing performance. Author and marketing metrics authority, Paul Farris, published: “Key marketing metrics: the 50+ metrics every manager needs to know” in 2009. More recently, Farris et al. (2015) actively refuse to offer a ’key set’ or ‘top 10’, citing the importance of selecting the right metrics for the type of organisation and its specific needs. The authors do however note that the most popular metrics amongst managers are the financial metrics of net profit, ROI and margin (but not necessarily for good reason), with customer satisfaction the most popular non-financial metric.

Farris et all. (2015)  offer a holistic graphical representation to demonstrate the interlocking nature of all marketing metrics (and marketing programs) and the central role of the customer:


Farris 2015

Marketing metrics is a minefield for the uninitiated and it is understandable is our fast-paced business world that silver metrics are sought by managers. Considerable work is being undertaken by companies to find the perfect dashboard and further work to standardise the marketing metrics. But even the ‘perfect dashboard’ of cleverly selected metrics may still prove elusive, something Bradley & Kiley identified back in 2004:

“For all the effort to bring science to marketing, the art component will never go away. Figuring out how much of a product’s appeal is due to marketing and how much stems from innovative features or quality is often hard to pin down, even for individual consumers. They don’t know why they like it, they just do. That’s the human factor — and so far, no one has found a way to measure that”.

References

Ambler, T and Roberts, J 2008, ‘Assessing marketing performance: don’t settle for a silver metric’, Journal of Marketing Management, Vol. 24, Iss 7-8, 2008

Bradey, D  & Kiley, D 2004,’Making Marketing Measure Up Taking the guesswork out of ad spending’ Business Week -New York-, 3912, pp. 112-113, British Library Document Supply Centre Inside Serials & Conference Proceedings, EBSCOhost, viewed 25 May 2016.

Cameron, N 2015, Why marketing analytics is not about ROI calculation, but innovation, CMO, viewed 24th May 2016, http://www.cmo.com.au/article/585507/why-marketing-analytics-about-roi-calculation-innovation/

Farris, P, Bendle, N, Pfeiffer, P, Rubstein, D 2015, Marketing Metrics: The Managers Guide to Measuring Marketing Performance, Pearson Education

Kotler, P, & Keller, K 2012, Marketing Management, Pearson Education.

Muntz, O and Currim, I.S 2013, ‘What Drives Managerial Use of Marketing and Financial Metrics and Does Metric Use Affect Performance of Marketing-Mix Activities?’ Journal of Marketing, , Vol. 77, pp. 17-40, 2013

Williams, A 2016,  How Nivea delivered a better ROI on marketing spend, CMO,  viewed 24th May 2016 http://www.cmo.com.au/article/595988/how-nivea-delivered-better-roi-marketing-spend/

Analysing the Analytical: How Does Internet Giant Google Analyse their own Marketing?

google under mag glass

Google is a household name. The word google has even made its way into our everyday vernacular with “just google it” being the answer to almost everything and you will be sure to find some kind of answer there. So how does a multi-gazillion dollar company like Google evaluate its own marketing to become such a successful entity that it is today? Could it be a case of practice what you preach? And how effective is it?

Google advertising

Yes, you may not think so but Google do advertise. You might think that a company like Google does not need to advertise itself but it does. With competition like Microsoft and Yahoo hungry for consumer attention, Google need to stay on top of their game. In fact, Google is reputed to spend about $4 billion on advertising per year. Here is one of their online advertising campaigns featuring multiple products called “Dear Sophie”. Warning: If you are a parent like me, have a few tissues ready.

In India, Google apparently has 97% market share and yet here is a 3.32 minute long ad promoting Google’s “search” function.

And there are many more. But I won’t bore with more of Googles long winded ads which they claim to be much better for changing a consumer’s mind and for brand recall. So, why does Google need to advertise itself in a market where it dominates? Is it to stay on top? Is it to continue to dominate and stave off the competition from Bing or Yahoo?

Although Google tries to convince most of its clients to spend their advertising dollars on online advertising, Google themselves advertise on TV.

Source: Kantar Media

Source: Kantar Media

It is obviously a strategy of trying to gain new customers who are not online since they dominate the online world already so why advertise to people who already buy into your product, right?

So how does Google measure or evaluate its own marketing? Which marketing metrics do they use to assess their marketing performance? Ambler and Roberts (2008, p. 745) discuss the notion of not settling for a “silver metric” and that multiple metrics need to be considered in order to assess marketing performance. Hence, we can safely assume that a large and very successful company like Google would definitely consider every metric available considering they have access to very, very, and I mean huge amounts of big data. Google operates nearly everything through big data, even right down to how they hire their staff. The following video shows just how big Google is.

“If you can’t measure and quantify it, how can you hope to start working on a solution?” said Bill Maris, managing partner of Google Ventures. “We have access to the world’s largest data sets you can imagine, our cloud computer infrastructure is the biggest ever. It would be foolish to just go out and make gut investments.”

“If you can’t measure and quantify it, how can you hope to start working on a solution?”

Whatever metrics that Google uses, we can only speculate on, as their methods and algorithms are a tightly held secret. So let’s start by considering Google’s “google analytics” software…

What is google analytics?

First introduced in 2005, Google analytics is a free web analytics service that tracks and reports website traffic. It can be defined as a powerful tool for measuring the success of one’s website, their marketing efforts, and their products and services (Ledford JL, Teixeira J, Tyler ME, 2010, p. xxiv). It is a software program that generates metrics or measurements such as the number of people who come to your site, how they get there and what they are doing while they are there and much much more.

So if you’re really serious about analyzing your marketing like L’oreal or Nest, you get the ‘Gucci’ version of Google analytics called Google Analytics 360 Suite. The Google analytics 360 suite was released recently and is an upgraded version of their Google analytics premium with a nice price tag of approximately $150K per year subscription.

Can we assume that Google might use their own analytics software or perhaps a more sophisticated version of this software to track their marketing performance? Or perhaps some fancy complex algorithms only known to them to keep ahead of the competition?

Do Google consider consumer behavioural metrics?

Google analytics is one of the most popular metrics software that businesses use to track website traffic and clicks. And what’s more – it’s free! People underestimate the power of free because consumers love getting products for free and this stimulates consumers to try new products (Pauwels and Weiss, 2008, p. 14). When google analytics was first released in 2005, sign-ups had to be suspended because Google could not cater to the demand. Since then, Google has since released many other paid products such as Adwords and AdSense and home and office subscriptions of gmail and docs and many others. One of the biggest complaints from consumers is Google’s habit of withdrawing products or features of products even though they are still in use by consumers and sometimes those products are never replaced. Or forcing users of their products to use only Google-related products for which Google were fined.  This could potentially cause consumers to turn to a competitor to find a similar product to satisfy what they want. Could the defection rate or customer complaints be too negligible compared to the cost of maintaining those products and keeping them on the market? Or are these behavioural metrics not measured or considered? How is it possible for Google to be fined? Did they not consider this outcome?

search graph

Google experiments on memory metrics

Google tested 3 versions of the same ad 15 second, 30 second and 2.17 minute ad compared when viewed online and compared the metrics in consumer; tested how viewers responded by how much they watched, ad recall and brand favourability from the ads.

What they found is that making ads shorter does not necessarily get more attention, and making ads longer allows for the weaving of a greater story around the brand. Having a 30 second ad was found to be the best and Google suggested that “weaving a brand early in the storytelling” was better. This is a testament to Google’s commitment to its consumers assessing how a client’s brand needs to be weaved into an ad and looking at consumer’s attention span for an ad. Or is this a ploy to utilize Google products and stay with Google longer?

How can Google stay on top?

Google has a weakness in its physical availability metrics. Let’s face it, Google is an online company, it is all about technology and it was recently identified in a SWOT analysis that its business is too dependent of the internet and it has minimal physical presence. This may be why recently the Google company was splintered to form Alphabet Inc as a parent company which now overseas a number of other operations such as robotics and life sciences to expand their business model. It will be interesting how they consider marketing this in the future.

Published by Patricia Vietheer (Student Number: 215464584)

References:

Ambler T, Roberts, JH, 2008, Assessing marketing performance: don’t settle for a silver metric, Journal of marketing management, Vol 24, No 7-8, pp 733-750.

Ledford JL, Teixeira J, Tyler ME, 2016, Google Analytics 3rd Edition. Hoboken, US: Wiley, 2010. ProQuest ebrary. Web. Accessed: 21 May 2016.

Mintz O, Currim IS, 2013, What drives managerial use of marketing and financial metrics and does metric use affect performance of marketing-mix activities?, Journal of Marketing, Vol 77, pp 17-40.

Pauwels K, Weiss A, 2008, Moving from free to fee: How online firms market  to change their business model successfully, Journal of marketing, Vol 72, p. 14-31.


Marketing Performance Dashboards

Deakin email address: asidh@deakin.edu.au

Companies using analytics tools are outperforming their competitors. Adobe Marketing Cloud users are seeing even greater results and benefit from 5.3% year-over-year increase in return on marketing investments compared to a 0.4% increase from their peers.

Marketing managers need metrics to assess the performance of their investments in advertising campaigns and other avenues of marketing spend. Marketing metrics refer to the set of measures that assist marketers to quantify, compare and interpret marketing performance.

Marketing managers cannot manage what is not measured; hence managers need to select specific metrics that are relevant to their industry in assessing their performance (Iacobucci 2013, p. 218). Examples of marketing metrics include sales turnover, market share, average prices, levels of consumer awareness and penetration in trial (Iacobucci 2013, p. 218). The picture below presents a myriad choice of KPIs or metrics available for marketing managers to consider in assessing performance.

For example, crucial marketing metrics include leading indicators as the more leads a marketing initiative generates, the more sales opportunities a business has to drive sales growth. However as discussed later, managers should not solely rely on a ‘silver metric’ to assess performance.

Dashboards provide managers the means to oversee multiple measures to optimally manage their companies (Iacobucci 2013, p. 219). A business dashboard is a data visualization tool that displays the current status of metrics and key performance indicators for a business. Dashboards consolidate and arrange metrics or scorecards on a single screen (Iacobucci 2013, p. 218). The essential feature of dashboards is  the ability of managers or users of the dashboards to customise the metrics presented on the dashboard over time and across departments.

It should be noted that the metrics used by management to assess marketing performance should not be solely limited to ‘silver metrics’ such as return on investment or discounted cash flows. The reliance on ‘silver metrics’ could result in management forming false diagnoses of marketing performance (Ambler & Roberts 2008, p. 733).

Most high performing management teams utilise the multiple metric approach in designing their dashboards, which bring together multiple measures into a clear integrated and concise package. Marketing managers  can  simultaneously view a range of metrics on a single page or screen giving an easy-to-read summary of up to twenty key marketing metrics rather than being driven by a single ‘silver metric’ such as ROI (Ambler & Roberts 2008, p. 743).

It was difficult to get a clear picture of our marketing data when it lived in silos. Now, seeing it in an integrated dashboard, we can quickly pinpoint gaps and successes – Guy Fish, Marketing, H&R Block

Some of the reputable vendors of dashboard platforms include IBM Cognos, Oracle and Microsoft. Datorama specialises in developing dashboards to support marketing intelligence.

“Datorama has drastically improved how we measure and analyze all of our marketing  activity. It enabled us to quickly centralize our reporting across all of our (previously)  siloed data in an easily customizable way. Now, we can automatically produce visual and  interactive reports that can be replicated globally across our 60+ entities.”  Kyle Webb, Group Digital Analyst, Michael Page

Marketing dashboards generate efficiencies by using the business’ marketing
resources to handle higher value  decisions, rather than juggle  multiple platforms and agencies. The other benefits of a marketing dashboard include:

Marketing Analytics
  • Data aggregation from any channel: Cross-channel insights.Optimize marketing performance.  Compare all of your online and
    offline marketing and sales  channels in a single dashboard.
  • Automatic data modeling
  • Data Visualization
Recommendations and Actions
  • Professional recommendations
  • KPIs management
  • Alerts and notifications
Cross-Channel Reporting
  • Various reports options: Easily schedule
    automatic reports. Quickly generate
    flexible, customized analysis of  marketing initiatives’ impact.
  • Public and private sharing
  • Internal collaboration

A demonstration from Domo, another vendor of marketing dashboards is presented below.

Student name: Amarjit Sidhu ; ID: 93072431

References:

Ambler, T, & Roberts, J 2008, ‘Assessing marketing performance: don’t settle for a silver metric’, Journal Of Marketing Management, 24, 7/8, pp.733-750, Business Source Complete, EBSCOhost, retrieved 18 May 2016, <http://web.b.ebscohost.com.ezproxy-f.deakin.edu.au&gt;

Datorama – Marketing Intelligence, retrieved 23 May 2016,  <http://direct.datorama.com/lp3/&gt;

 Iacobucci, D 2013, Marketing Management (MM4), Student Edition, South-Western, Cengage Learning, Mason, Ohio.

The Numbers Don’t Lie…Or Do They? The Challenge of Evaluating Marketing

Marketing, March 2013

Does evaluating marketing based on numbers stifle creativity?

With today’s increasingly competitive marketplace, businesses are beginning to tighten their spending and are ensuring that everything they do results in positive income for their company. This want for accountability across all departments has led to a spotlight being shined on marketing in order to justify spending on advertising and branding.

Marketing has widely been regarded as one of the most important factors for a company’s success, yet when push comes to shove and costs need to be minimized, it is often one of the first budgets to be criticized and slashed.

Now, why would something that is seen as a vital part of an organization be the first on the financial chopping block? The answer lies in the difficulty of directly evaluating marketing and the use of “silver metrics” to measure the success or failure of a marketing campaign.

Properly understanding how to measure marketing is quite important for a company to understand as making the wrong marketing decisions based on poor metrics can lead to a loss of future revenue, or worse, closure of business.

Holding marketing accountable and providing metrics to shareholders to quantify marketing spend is reasonable, but which metrics do we use to properly measure marketing and why is measuring the effectiveness of marketing so challenging?

Marketing metrics are defined as the set of measures that help marketers quantify, compare and interpret marketing performance. These metrics are meant to help managers know how the marketing being done to promote a company/brand is performing.

Sharp (2013), breaks marketing metrics in to 6 categories that can be selected from to evaluate marketing:

Financial Profit Contribution

Profit Margin

Return on Investment (ROI)

Customer Value

Behavioural


Sales

Market Share

Market Penetration

Purchase Frequency

Share of Category Requirements

Memory


Brand Awareness

Brand Image Associations

Mental Availability

Attitude

Customer Satisfaction and Service Quality

Intention to Buy

Physical Availability


Number of distribution points

Hours of opening

Geographical coverage of distribution points

Geographical coverage of delivery points

Number of display points in store

Number of shelves devoted to the brand

Marketing Activity


How much is being spent on marketing

What marketing activities are being run simultaneously

Customer Profile


Describes the company’s customers

Gender

Age

Income

While the above metrics are logical and provide good overall indicators, problems arise when marketing strategies are quite complex.

Iacobucci states that most consumers often can’t recall where they experienced a company’s marketing message making it very hard to assess the efficacy of one ad campaign vs. another when multiple advertising activities are being run simulatenously (quite common).

Furthermore, it is quite common that a CEO is interested in short term results and looks for a direct ROI associated to marketing. This type of approach can stifle creativity of ads that are not intended to immediately increase ROI, yet, perhaps build a long term brand loyalty. ROI, fails to calculate the creation of a long term customer and relationship.


Return on Relationship™… simply put the value that is accrued by a person or brand due to nurturing a relationship. ROI is simple $’s and cents. ROR is the value (both perceived and real) that will accrue over time through loyalty, recommendations and sharing. 

Ted Rubin

While there are companies that make a business of selling metrics tools such as Google Analytics, Adwords, and CRM software such as SalesForce, what is the true value of tracking number of clicks on a webpage, visits to a site, number of likes on a facebook advertisement or retweet on Twitter?analytics-screens-devices-ss-800.jpg

These numbers that are gathered look great on a marketing report, however actually putting a numeric dollar value on an advertising campaign is downright, nearly impossible.

In conclusion, Metrics are important for every department in an organization, marketing included. However, it is important to have an open view when analysing the success of a marketing campaign above and beyond basic dollar value. If you still have doubts, I urge you to look at success stories such as Go Pro, RedBull and Monster, who created lifestyle brands over a long period of time.  For those still on the ROI is the only judge of success, I ask you to tell me which exact advertisement or campaign was directly responsible for the success of companies like those.

MWEATHE
216041883
mweathe@Deakin.edu.au

References and Further Reading

Adage.com. (2016). The failure of marketing ROI. [online] Available at: http://adage.com/article/btob/failure-marketing-roi/285686/ [Accessed 19 May 2016].

Businessreviewaustralia.com. (2016). The Big Bad ROI Question. [online] Available at: http://www.businessreviewaustralia.com/marketing/906/The-Big-Bad-ROI-Question [Accessed 21 May 2016].

Cimala, T., Crestodina, A., Gant, A. and Crestodina, A. (2014). 8 Ways to Use Google Analytics to Measure the Success of Your Content Marketing – Orbit Media Studios. [online] Orbit Media Studios. Available at: https://www.orbitmedia.com/blog/8-ways-google-analytics-measure-success-content-marketing/ [Accessed 20 May 2016].

Content Marketing Institute. (2014). A Simple Plan for Measuring the Marketing Effectiveness of Content. [online] Available at: http://contentmarketinginstitute.com/2014/07/simple-plan-measuring-marketing-effectiveness-of-content/ [Accessed 20 May 2016].

Docurated. (2015). How to Measure Marketing Effectiveness: Tips from 26 Experts. [online] Available at: http://www.docurated.com/all-things-productivity/whats-your-1-way-to-measure-marketing-effectiveness [Accessed 19 May 2016].

Eisenberg, B., Litsa, T., Sentance, R., Singer, A. and Sentance, R. (2016). The Difference Between ROI and Marketing Accountability | ClickZ. [online] Clickz.com. Available at: https://www.clickz.com/clickz/column/1697512/the-difference-between-roi-marketing-accountability [Accessed 21 May 2016].

Forbes.com. (2016). Forbes Welcome. [online] Available at: http://www.forbes.com/sites/forbesinsights/2013/07/09/why-roi-is-often-wrong-for-measuring-marketing-impact/#4d2c375412f3 [Accessed 23 May 2016].

Forty. (2011). Metric-lust: how well can you really measure marketing ROI? – Forty. [online] Available at: http://forty.co/metric-lust-how-well-can-you-really-measure-marketing-roi [Accessed 22 May 2016].

Genow, J. (2016). Measuring Marketing ROI: Good or Bad for Marketing?. [online] J. Genow Marketing. Available at: http://jgenowmarketing.com/measuring-marketing-roi/ [Accessed 20 May 2016].

Gerber, S. (2014). 12 Ways to Measure Your Marketing Impact. [online] Mashable. Available at: http://mashable.com/2014/06/06/find-marketing-results/#X8OCTsSuHsqt [Accessed 22 May 2016].

Johnson, S. (2016). Why Marketing Budgets Get Cut (and Why You Shouldn’t Cut Yours!). [online] Promotional Products Blog | Quality Logo Products (QLP). Available at: https://www.qualitylogoproducts.com/blog/marketing-budgets-dollars-cut/ [Accessed 20 May 2016].

Marketing Science Institute. (2016). [online] Available at: http://www.msi.org/reports/beware-the-silver-metric-marketing-performance-measurement-has-to-be-multid/ [Accessed 23 May 2016].

McKinsey & Company. (2012). Measuring marketing’s worth. [online] Available at: http://www.mckinsey.com/business-functions/marketing-and-sales/our-insights/measuring-marketings-worth [Accessed 21 May 2016].

Miller, J. (2013). How to Measure the ROI of Marketing Programs – Marketo. [online] Marketo Marketing Blog – Best Practices and Thought Leadership. Available at: http://blog.marketo.com/2013/03/how-to-measure-the-roi-of-your-marketing-programs.html [Accessed 21 May 2016].

Score, P. (2016). 18 Marketing Performance Metrics that Matter. [online] Themarketingscore.com. Available at: http://www.themarketingscore.com/blog/bid/220074/18-Marketing-Performance-Metrics-that-Matter [Accessed 21 May 2016].

Smallbusiness.chron.com. (2016). The Importance of Marketing for the Success of a Business. [online] Available at: http://smallbusiness.chron.com/importance-marketing-success-business-589.html [Accessed 20 May 2016].

The Content Strategist. (2016). The Biggest Reason Brands Fail When Tying Content to Business Goals. [online] Available at: https://contently.com/strategist/2016/03/09/biggest-reason-brands-fail-tying-content-business-goals/ [Accessed 21 May 2016].

Everyday Rewards… Pulling the Wool over our eyes

card.jpg

Loyalty is big business, with many consumers willing to hand over their personal details in exchange for a card, hoping it will provide them shopping benefits. A recent market industry study suggests that when choosing between two competing brands, 55% of buyers said they will choose the one with the loyalty program.

With consumers having more and more choices when it comes to where they buy their groceries, are loyalty cards rewarding shoppers with what they want or are they just profiting the big supermarkets? The Woolworths’ Everyday Rewards program has close to nine million members, who receive discounts on specific (orange non-essential ticketed) items in-store. The purchase discounts are accrued only on products that have the orange ticket, these add up to monetary savings in future at the check-out. A recent Monash University study suggests that a typical loyalty card shopper will save about $1.25 per $100 spent. That is $1.25 to spend on items selected by the supermarket… sounds like an everyday reward right?

girl

A measure of success

Loyalty programs provide retailers with a significant amount of data-metrics and information about the consumers and their purchasing behaviors.

Marketing metrics can be used to help quantify marketing actions and their impact on financial statements, and can be used to evaluate past performance and to help fine tune future strategies. Collected data over time can provide a broader understanding of a customer-type and can formulate strategies based around this – taking marketing from being seen as just a “superstition” into more of a science.

Metrics measurements can be displayed as follows:

MMetrics

And the reward goes to…

Loyalty programs provide organisations with a significant volume of data. From the moment the customer signs up, (where they put in their gender, age, address, personal situation and shopping preferences), this information is recorded. Once the customer starts making transactions using the loyalty card, data starts being collected and a profile is immediately formed, tracking buying habits; when, what and how much of these items you buy. Or as Woolworths puts it collecting data: to “learn of your likely preferences so that we may promote our goods and services to you in a way which may be of most interest to you“. In other words, to try to find new ways to make you spend more, they will offer you targeted deals to try to encourage greater spend. This is targeted marketing at its best; relying on quantifiable collated metrics over time that gets better with age.

Big data is big business and is helping to transform the way companies market. Woolworths spent $20M to acquire a major share in the analytics firm Quantium, to help them manage their data more effectively and to help them build some more financially quantifiable ROI from their marketing – taking it “from data to dividend“. The results of this business move, opened pathways for Woolworths to then be able to cross-examine their loyalty card purchasing habits with claims made in their Woolworths – branded insurance. This helped them to predict risk and allowed them to market better to low-risk customers (or to those who drank more milk and ate more red meat), whilst also helping them to save on advertising.

The benefits of loyalty programs are clear for big business, with them collecting large amounts of quantifiable data and deeper insights over periods of time. But… to the consumer there is a trade-off between the small rewards and maintaining your privacy.

drevil

So shall we all hide under rocks to escape the big data targeted metrics marketing revolution? That is one option, or you can just pay cash…


By Damien Mulhall Student ID: 212241227 WordPress User Name: damienmu


References

Angus Kidman 2016, Woolworths Everyday Rewards becomes Woolworths Rewards: Everything you need to know, Retrieved 20th April 2016, <http://www.finder.com.au/woolworths-rewards-faq>.

Author Unknown 2013, Big data gets bigger: Supermarkets approaching 10 million FlyBuys or Everyday Rewards cardholders, Retrieved 20th April 2016, <http://www.roymorgan.com/findings/5277-big-data-at-supermarkets-flybuys-vs-everyday-rewards-june-2013-201311032158>.

Daniel Graham 2016, Discounts for data, Retrieved 20th April 2016, <https://www.choice.com.au/shopping/consumer-rights-and-advice/your-rights/articles/loyalty-program-data-collection>.

David Flynn 2016, Woolworths brings back Qantas frequent flyer points for shoppers, Retrieved 20th April 2016, <http://www.ausbt.com.au/woolworths-brings-back-qantas-frequent-flyer-points-for-shoppers>.

Iacobucci, D. 2015. Marketing Management. First Edition. Cengage Learning, Stamford, USA

Jayson DeMers 2014, 10 Online Marketing Metrics You Need To Be Measuring, Retrieved 20th April 2016, <http://www.forbes.com/sites/jaysondemers/2014/08/15/10-online-marketing-metrics-you-need-to-be-measuring/#5c96ba5f355f>.

Jemima Whyte, 2015, Which supermarket loyalty points get you a better deal: Coles or Woolworths?, Retrieved 20th April 2016, <http://www.afr.com/business/retail/which-supermarket-loyalty-points-get-you-a-better-deal-coles-or-woolworths-20151028-gkl7k4>.

Kevin Cain 2012, Measuring Marketing Effectiveness: 6 Metrics You Need to Track, Retrieved 20th April 2016, <http://contentmarketinginstitute.com/2012/10/measuring-marketing-effectiveness-metrics/>.

Monash Business School, ACRS Review of Woolworths ‘Woolworths Rewards’ program, Retrieved 20th April 2016, <http://business.monash.edu/__data/assets/pdf_file/0003/356556/ACRS-Review-of-Woolworths-Rewards-program.pdf>.

Myriam Robin 2013, Why loyalty cards are Woolworths’ secret weapon in supermarket wars, Retrieved 20th April 2016, <http://www.smartcompany.com.au/people-human-resources/managing/39563-why-loyalty-cards-are-woolworths-secret-weapon-in-supermarket-wars-2/>.

Natasha Wallace, Sarah Whyte 2013, Supermarket spies: big retail has you in its sights, Retrieved 20th April 2016, <http://www.smh.com.au/digital-life/consumer-security/supermarket-spies-big-retail-has-you-in-its-sights-20130914-2trko.html>.

Professor David J. Reibstein 2013, The Importance of Marketing Metrics, Retrieved 20th April 2016, <http://www.insead.edu/executive-education/interviews/marketing-sales/the-importance-of-marketing-metrics>.

Rachel Browne 2015, The price of loyalty: are rewards schemes worth it?, Retrieved 20th April 2016, <http://www.smh.com.au/business/retail/the-price-of-loyalty-are-rewards-schemes-worth-it-20151029-gklqxh.html>.

Sharp, B 2013, ‘Marketing: theory, evidence, practice’, Oxford University Press, Melbourne, Australia

MasterClass in Metrics

By Kaitlin Hastie : WordPress User khastie : Student ID 215268319

MC2015_Logo_500x281

Last night Nigella didn’t just warm up the MasterChef kitchen, but she also helped increase the temperature on the shows TV ratings. MasterChef is now in its 8th season, and popularity for the show is still just as strong. However how does this global brand measure its marketing success?

Evaluating the marketing of brands

Evaluating the successful marketing of a brand is not as straightforward as you may think. There is not one correct way to evaluate a marketing strategy as every company or product has different strategies, metric orientations, marketing mix and managerial and environmental characteristics.

This can be seen when considering the MasterChef brand. There are a number of factors that need to be considered when evaluating the success of the marketing strategy. Some of these include:

  • The global nature of the brand
  • The influence that the spin-off shows have on the brand
  • That the MasterChef brand is involved in product placement, such as cookbooks and cooking utensils
  • Celebrity endorsements
  • Sponsorship from other high profile companies and brands.

There is a range of thoughts on how to effectively evaluate the marketing strategies of companies. Krakowiak looks at measuring the success of a brand through its social media presence. However they argue that this form of measurement is still ambiguous and may not always result in brand engagement. Ginevcius et al look at a quantitative analysis of marketing and states that this has to be multidimensional in the metrics that are chosen. They also point out that if values increase in some criteria, while initially indicating that the situation is getting better, other criteria may be decreasing. This again highlights the multidimensional nature of evaluating marketing strategies. Ambler et al argues that you need to also look at a multiple metric approach and focus on; financial measurement, return on investment, discounted cash flow, return on customer and finally ensure that the short and long term goals are explicit. Overall Ambler et al argues that you need an appropriate tool to measure the success of each criteria, such as a dashboard.

How does MasterChef evaluate its success?

Clearly MatserChef has done something right. It is one of the most viewed shows on Australian TV. However it has also had it challenges. In 2010 MasterChef broke TV ratings when 3.9million people turned in to watch the season two finale. By 2013 the TV audience for finale was only 1.06million. This step decline was attributed to the MasterChef brand flooding the market with to many spin-off shows, such as celebrity and kids shows. The brand also tried to complete with the My Kitchen Rules culture of focusing on the group dynamics of the contestants rather then the actual food.MC7_Ep_62_3789

Overall this marketing campaign can be seen to not be effective, an MasterChef went back to what it does best; to find people who are good cooks, develop them and also allow viewers fall in love with the contestants. This shows that TV ratings are a good way to measure the quantitative success of the brand.

However TV ratings are not be the only way that we can evaluate the success of the MasterChef brand. Instead another metric is to look to the large number of sponsors that sign on to the brand each season. This years sponsors include Coles, Harvey Norman, Swisse and Qantas. Swaminathan et al argue that marketers are able to borrow equity from the partner brand as consumer behaviour can be positively influenced with cobranding with the right brand. Again this highlights the ambiguity around the qualitative success of a brand. How do you measure the value that each brand has got out of aligning with each other?

Other ways that we can look at evaluating the MasterChef brand would be through the large number of celebrity endorsements or sales of the MasterChef products.

Food for thought

One thing is clear, for MasterChef to continue its strong success it needs to ensure that it has clear business proposition. The marketing strategies must be able to align with the success of these objectives.

It is important to note that not all marketing strategies will be the same, and the measurement of these strategies will hence differ. However as long as you have a clear company objective, agreed metrics to measure and an appropriate tool to measure the success of the strategy, marketing will continue to have its place within any brand or organisation.

MC2015_M01_900x506

Marketing Evaluation on Nurofen Incident

Jewel Huang/216216298

Marketing metrics serve as accountable measures for an organisation’s strategic plans and marketing productivity. They are also powerful diagnostic tools for performance improvement (Krishnan, 2006).

Selection of metrics

It is recognised that managers may favour some metrics over others (Mintz and Currim, 2013). Some self-claimed “marketing experts” advise managers to focus on the set of metrics interpreting short term profit such as Return on Marketing Investment (ROMI), Customer Acquisition Cost (CAC), Ratio of Customer Lifetime Value to CAC, Time to Payback CAC, etc., on the assumption that CEOs prioritise the measures of cost vs. revenue.

Ambler et al. (Ambler and Roberts, 2008) have suggested to use a combination of financial and non-financial (i.e. marketing) metrics to evaluate the intermediate and long-term performance of marketing-mix activities. The marketing metrics are based on customers’ mind set, including customer awareness, preference, satisfaction and loyalty. The employment of metrics is associated with the organisation’s financial and marketing performance (Mintz and Currim, 2013). Failure to integrate marketing and financial metrics may lead the marketing activities off track. Nurofen’s campaign of ‘targeted relief from pain’ illustrated such an example.

The rise of the campaign

Since 2004, Reckitt Benckiser, a pharmaceutical giant, had been promoting the Nurofen painkiller series, claiming to target for specific pains such as headache, back pain, migraines and period pain.

Nurofen packaged the same active ingredient ibuprofen in different labels and charges a premium price almost double that of general painkiller products.

Nurofen compare

Giving the freedom to customers to choose the same thing, Nurofen effortlessly won customer loyalty and instant profit. Nurofen was awarded Choice Shonkys in 2010. In 2013, Nurofen led 22% market share in Australian painkiller industry among a total $629 million industry revenues, far higher than other brands using the same ingredient (Castle, 10th September 2014). At this stage Reckitt Benckiser’s financial metrics showed green ROMI and juicy profit contribution.

The fall of the campaign

However, pharmaceutical expert revealed that ibuprofen does not have selectivity for specific pains (Castle, 2014) and Nurofen misled customers by its targeted pain relief claims. In 2015, Australian Competition and Consumer Commission (ACCC) took Nurofen to Federal Court. The Court found that “Reckitt Benckiser made misleading representations on the packaging of each Nurofen Specific Pain product” and fined Reckitt Benckiser $1.7 million. Additionally, ACCC appealed to the Court for an extra $6 million penalty.

The loss to Reckitt Benckiser may not only be the monetary penalties, but more seriously the damage to its brand equity. Brand equity is defined as “the differential effect of brand knowledge on consumer response to the marketing of the brand” and contains trustworthiness from customers and stakeholders (Keller, 1993). Reckitt Benckiser’s misleading marketing to vulnerable people suffering pain for its own profit made financial and emotional damage to the customers, directly destroying the customers’ trust and loyalty and eventually damaging its own brand equity.

Effect of metrics selection

Ambler (2008) has suggested that brand equity, as intangible asset, is associated with shareholder value and future financial return (Liu et al., 2012); thus should be included in multiple metric approach for long-term performance evaluation. Companies can build brand equity by making their products more reliable, more recognisable and in superior quality. Instead of building brand equity, marketers driven by short term profits could employ single silver metric and eventually feel the pain as Reckitt Benckiser.

 References

AMBLER, T. & ROBERTS, J. H. 2008. Assessing marketing performance: don’t settle for a silver metric. Journal of Marketing Management, 24, 733-750.

CASTLE, J. 10th September 2014. Pain-relief medication [Online]. https://www.choice.com.au/health-and-body/medicines-and-supplements/prescription-medicines/articles/pain-relief-drugs-panadol-and-nurofen: Choice.  [Accessed May 22nd 2016].

KELLER, K. L. 1993. Conceptualizing, Measuring, and Managing Customer-Based Brand Equity. Journal of Marketing, 57, 1-22.

KRISHNAN, B. C. 2006. Marketing and the bottom line: The marketing metrics to pump up cash flow, 2d edition. Journal of Marketing Research 43, 509-512.

LIU, Y., CHEN, Y., GANESAN, S. & HESS, R. 2012. Product-harm crisis management and firm value. In: GANESAN, S. (ed.) Handbook of Marketing and Finance. Northampton, USA; Cheltenham, UK: Edward Elgar.

MINTZ, O. & CURRIM, I. S. 2013. What drives managerial use of marketing and financial metrics and does metric use affect performance of marketing-mix activities? Journal of Marketing, 77, 17-40.